You need to enable JavaScript to run this app
All
Gene expression
TopAnat
Expression comparison
Raw data
SPARQL
Documentation and tutorials
Search Genes
Search
Gene : TLE3 - 108397785 -
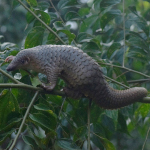
Manis javanica
(Malayan pangolin)
General information
Gene identifier
108397785
Name
TLE3
Description
Organism
Manis javanica
(Malayan pangolin)
Synonym(s)
Source data
Retrieve all processed expression values for that gene
Expression
80%
Reported absence of expression
80%
This website requires cookies, and limited processing of your personal data in order to function. By using the site you are agreeing to this as outlined in our
privacy notice
.
Do not show this banner again